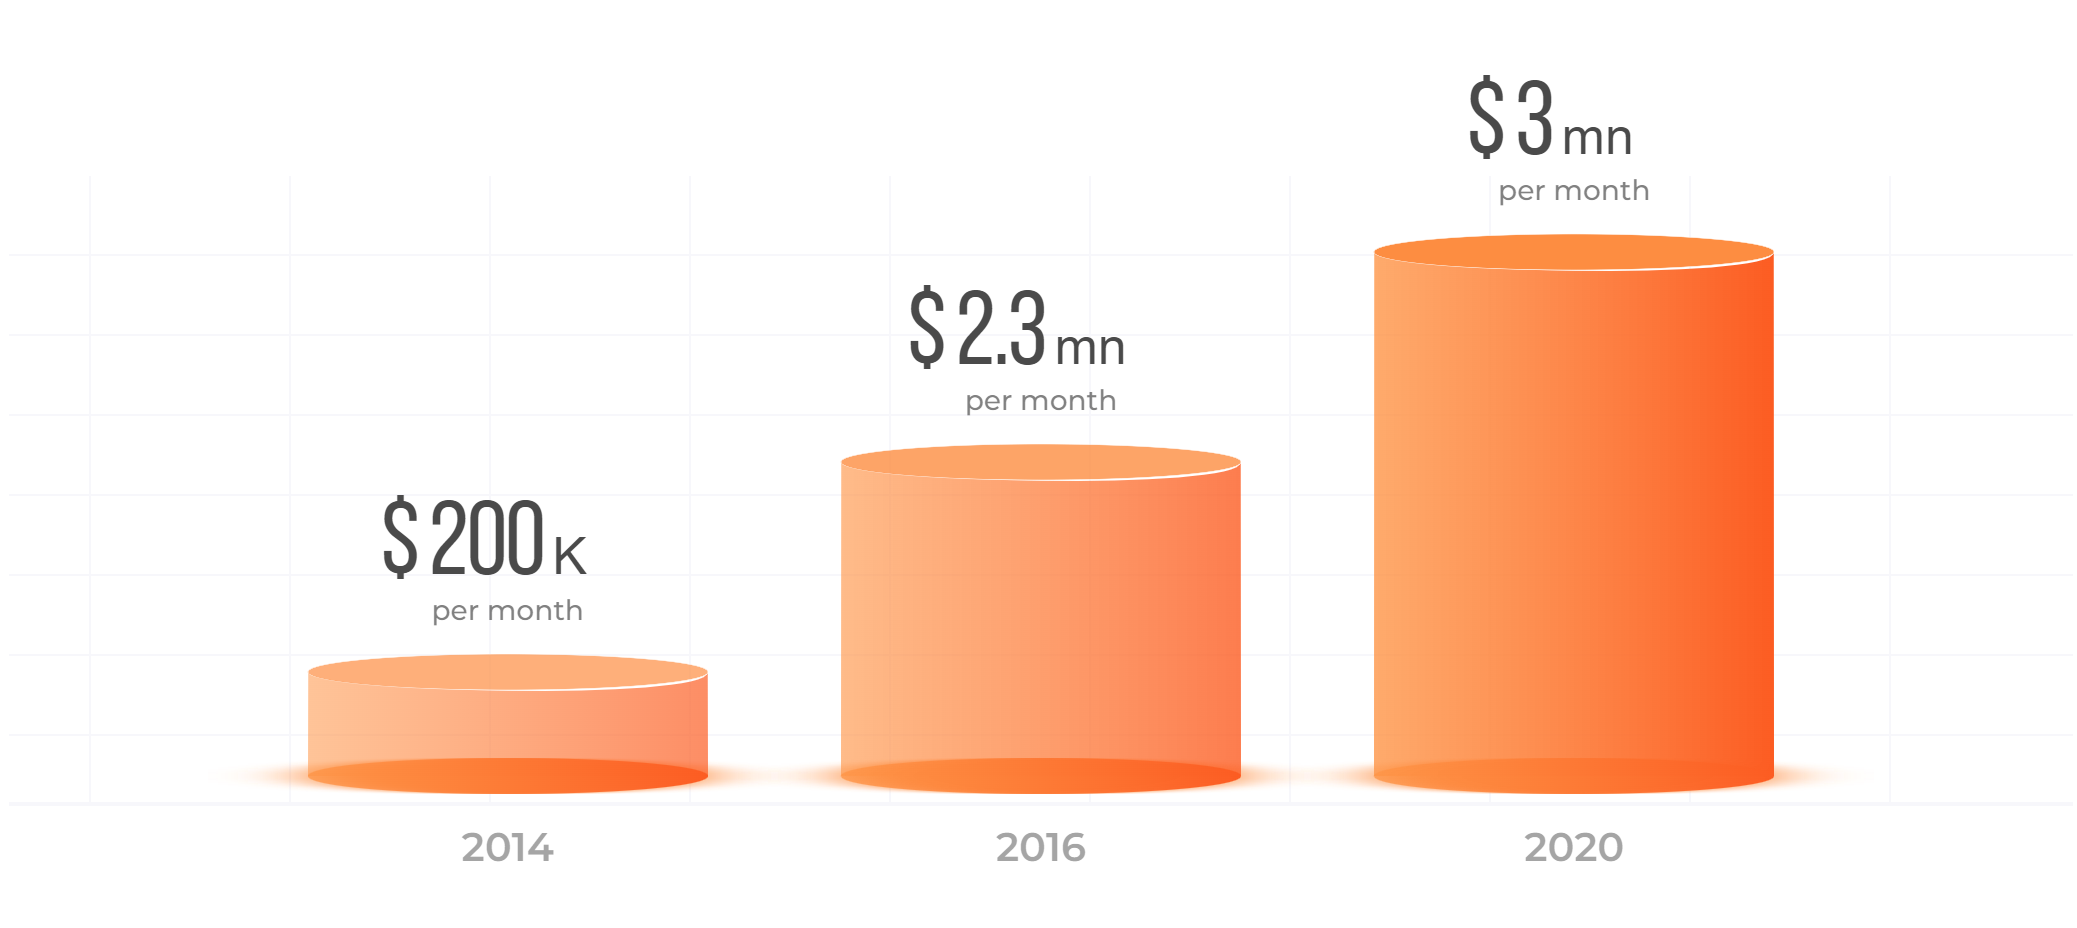
The number of active users is growing rapidly from year to year
registered investors
registered users
registered users
From 2014 to 2022, the number of trades made per day increased by more than 800%!
The total trade volume increased by 2100% between 2014 and 2022
Investors withdrew 2.9 times more money from the platform in 2021 than in 2016
per month
per month
per month
In 2016, we switched to a quick withdrawal system, which allowed us to process 98.5% of withdrawal requests immediately.
average time to process a withdrawal request
| 2014 | 2016 | 2021 |
2
|
46
|
43
|
Our support team started in 2014 when traders had to wait 2 minutes for an answer in chats. Today you can get an answer to any question in just 43 seconds.
| 2014 | 2016 | 2021 |
14
|
46
|
20
|
Complex questions that require thoughtful answers most often end up in our inbox. Today you can get an answer to your email in as little as 20 minutes!.
We are constantly improving our order processing system, and every year we reach new performance milestones.
Our affiliate program is the most profitable in the industry, and it's a fact proven by the numbers. Take a look at our affiliates' revenue growth over the past six years.
